Tableau - Stats Calculations
Tableau - Finding Averages
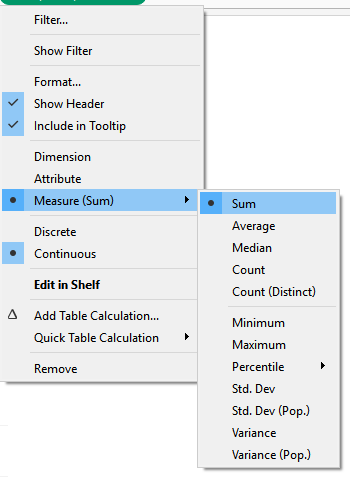
To find the average for a measure in tableau, right click on the measure and select average:
Definition: The average is also known as the mean in statistics. This is the sum of values divided by the number of observations.
The formula for the mean or average is:
Tip: Averages are very commonly used to summarize large amounts of data, but often they don't give you an accurate or whole data story. For instance, averages are influenced by outliers (large or small data points relative to your data). In these cases, the median may be a better statistic as this indicates the middle data point.
Tableau - Finding the Median
To find the median for a measure in tableau, right click on the measure and select median:
Note: The median is also known as the 50th percentile in statistics. This means half the observations fall below this value and half the observations are above this value.
Example:
Lets take a set of observations with the values: {1,2,5,10,1000}. What is the median value?
We can see the median value is the middle value in the ordered set. So in this case 5.
Example
Lets take a set of observations with the values: {1,2,5,10,11,1000}. What is the median value?
In this case he median or middle value is between 5 and 10.So we take the average of these two numbers to get 7.5
The distribution of numbers in this set is skewed right. This means that there is one or more very high values relative to the set. (In this case 1000). Because this set of numbers is right skewed it makes sense to look at the median to summarize the center point of the data values.
Tableau - Standard Deviation
To find the standard deviation for a measure in tableau, right click on the measure and select standard deviation:
Note: The standard deviation calculates the dispersion or spread of data. When data points are close together, the standard deviation is low. When data points are more spread out, the standard deviation is high.
How does tableau calculate standard deviation? By default tableau uses the formula for the standard deviation a sample size. This is often called the sample standard deviation for short and is an unbiased estimate for the population standard deviation.
Note: For those with an Excel bacgkround, tableau uses Excel's STDEV.S by default.
Formula:
Relationship between the variance and standard deviation: Standard deviation is the square root of variance.
Tableau - Variance
To find the variance for a measure in tableau, right click on the measure and select variance:
Note: The variance calculates the dispersion or spread of data. When data points are close together, the variance is low. When data points are more spread out, the standard deviation is high.
How does tableau calculate variance? Variance is the standard deviation squared.
Note: For those with an Excel bacgkround, tableau uses Excel's VAR.S by default.
Formula:
Tableau - Percentiles in Tableau
To find percentiles in tableau, right click on the measure and select percentile:
The drop down gives you several percentiles to choose from. By selecting Edit in Shelf (4th from the bottom) you can change to percentile to any value between 0 and 1.
Definition: The nth percentile is a value such that n percent of observations fall below that value.
Formula: The equation that tableau uses to calculate percentiles is two steps:
Step 1: Get the rank in the ordered set:
Step 2: Use the rank from step 1 above to get value of the element in the set associated with the rank.
Step 3: Use linear interpolation if needed when the rank is not a whole number.
Common percentiles are:
- 25th percentile (first quartile)
- 50th percentile (median)
- 75th percentile (third quartile)
Note: There are many formulas for percentiles. Tableau uses the same formula as Excel's PERCENTILE.INC function
Example:
Use the table below to work out the 20th, 67th and 95th percentiles for the following test scores:
| Rank (low to high) | Test Scores |
|---|---|
| 1 | 51 |
| 2 | 55 |
| 3 | 60 |
| 4 | 66 |
| 5 | 73 |
| 6 | 74 |
| 7 | 80 |
| 8 | 91 |
| 9 | 94 |
| 10 | 97 |
20th percentile: Using the formula above:
                               nth percentile: 0.2
                               number of elements in set: 10
                               formula for rank: 0.2(10-1) + 1 = 2.8
                               intuition: rank is between 2 and 3 so 20th percentile is between 55 and 60
                               linear interpolation:: 55 + 0.8(60-55) = 59
                               Conclusion:: 20th percentile is 59. 20% of test scores fall below 59.
67th percentile: Using the formula above:
                               nth percentile: 0.67
                               number of elements in set: 10
                               formula for rank: 0.67(10-1) + 1 = 7.03
                               intuition: rank is between 7 and 8 so 67th percentile is between 80 and 91
                               linear interpolation:: 80 + 0.03(91-80) = 80.33
                               Conclusion:: 67th percentile is 80.33. 67% of all values fall below this.
95th percentile: Using the formula above:
                               nth percentile: 0.95
                               number of elements in set: 10
                               formula for rank: 0.95(10-1) + 1 = 9.55
                               intuition: rank is between 9 and 10 so 95th percentile is between 94 and 97
                               linear interpolation:: 94 + 0.55(97-94) = 95.65
                               Conclusion:: 95th percentile is 95.65. 95% of all test values fall below this.
Word of caution: Percentiles are not percentages. Percentiles determines where a particular value stands in the data set, or would stand if such a value existed. Percentiles are a measure to determine where a value stands relative to other values.
Say everyone on a test has scored above 90%, but you score exactly 90%, then you would have done the worst on this test. In this case, your 90% test score would be the 0th percentile because nobody scored worse than you.
Now let's say your prof gives a super hard exam, and you score 50%. If everyone else scores below 50% then your test score of 50% is in fact the 100th percentile since nobody score better than you!
Data Analyst
Tableau Consultant
Power BI
Data Analytics
Google Ads Data Analytics
SEO Data Consultant
email me at: arhoy@ualberta.ca